Does Defense Win More Championships? Our Analysis Says No

You've heard it from some of sports' most notable broadcasters. You've seen it written in just about every sports publication in existence. If you haven't had at least one of your sports fan friends utter it at some point, then you probably need new sports fan friends.
Defense wins championships.
The spirit of the phrase is clear enough: when the games get super-serious, free-wheeling play is largely eschewed in favor of clamp-down defensive sequences. But is it actually true? Are defensive teams more successful at winning titles than teams that rely more heavily on offense?
We examined the four major North American pro sports leagues to see which title-winning trends have emerged biggest and brightest in each one. Here's a look at the respective seasons when we began tracking the data for each of the four leagues:
- NFL: 1966 (start of Super Bowl era)
- NBA: 1968-69 (expansion to 14 teams)
- NHL: 1967-68 (expansion to 12 teams)
- MLB: 1969 (expansion to 24 teams)
We broke down the regular season offensive and defensive rankings for every title participant in that span, using the most basic metrics in the interest of consistency and simplicity: Points, runs and goals scored for offense, and points, runs and goals allowed for defense.
We then asked the questions:
- What percentage of the time does the superior offensive team win the championship?
- What percentage of the time does the superior defensive team win the championship?
Here are the results from each of the four major North American pro sports leagues:

NFL
| Result | Rate |
|---|---|
| Better offensive team won | 52.8% |
| Better defensive team won | 65.5% |
- Average offensive ranking of championship winner: 5.6
- Average defensive ranking of championship winner: 5.7
- Average offensive ranking of championship runner-up: 5.0
- Average defensive ranking of championship runner-up: 7.9
While the NFL has gone through some fascinating phases in this regard, there's no denying that defense wins Super Bowls. Spoiler alert: the NFL boasts the highest rate of title success for superior defensive teams of any of the four major NA pro sports leagues, and teams that rank higher in points allowed fare considerably better than teams with a top-tier offense.
That said, there have been stretches where having the better defense hasn't helped at all. Five of the first six Super Bowl titles were won by teams with the inferior defensive metrics, and from 2004-14, just three of 11 championship teams boasted a better regular season defense than their opponents. Of course, that was a bit of a wacky stretch in general, with four different Super Bowl champions all having ranked in the bottom half in points allowed during the season.
Normalcy returned with emphasis in the subsequent years, with every Super Bowl winner from 2015-21 having ranked higher defensively. The Kansas City Chiefs broke that streak with a 38-35 win over the Philadelphia Eagles at Super Bowl 57, but with both teams ranking in the top-3 in points scored during the season, you kind of knew it wouldn't be a defensive gem.
Other interesting notes:
- Teams with the No. 1 offense during the regular season have reached the Super Bowl 25 times – but are just 11-14 overall in those title game appearances.
- Teams having allowed the fewest points during the season have played in the Big Game on 22 occasions, and have fared considerably better at 16-6.
- The last two teams to win the Super Bowl despite ranking worse than their opponent in both points scored and points allowed: The 2007 New York Giants (who beat New England) and the 2011 New York Giants (who beat New England).

NBA
| Result | Rate |
|---|---|
| Better offensive team won | 61.8% |
| Better defensive team won | 58.2% |
- Average offensive ranking of championship winner: 7.7
- Average defensive ranking of championship winner: 7.1
- Average offensive ranking of championship runner-up: 8.7
- Average defensive ranking of championship runner-up: 8.8
The edge here is slight, but it has actually been more beneficial for an NBA Finals participant to be stronger on the offensive end of the court.
The level of consistency across both metrics has actually been rather impressive. The NBA hasn't gone more than three straight years without the superior regular-season offensive or defensive teams winning the championship; by comparison, the NFL has had two separate five-year stretches in which the weaker offensive team won the Super Bowl.
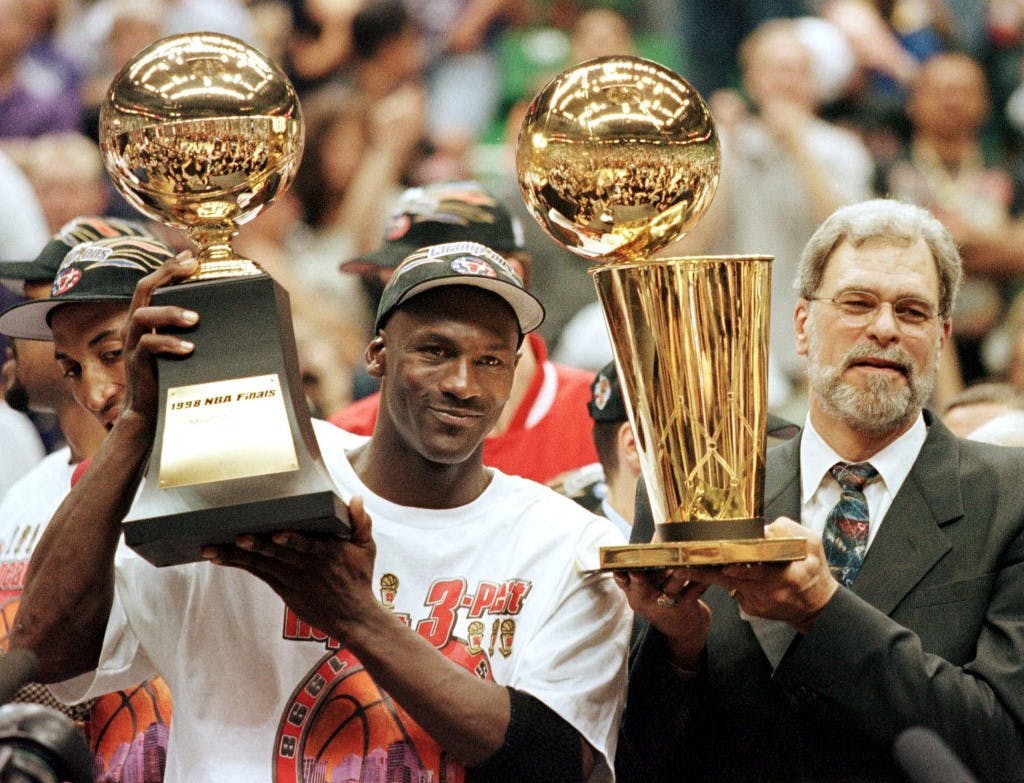
It helps, of course, that the NBA of the past 55 years has been largely defined by its dynasties. And whether you're talking about the dominant Lakers and Celtics teams of the 1970s and '80s, the Michael Jordan-led Bulls juggernauts of the 1990s or the Golden State Warriors of the modern day, it's fair to say that the majority of those teams dominated at both ends of the floor.
Other intriguing tidbits:
- The top-ranked NBA offense has reached the NBA Finals just 12 times since 1969, but has won nine times over that span.
- The NBA's top defensive team has advanced to the title series eight times, going 6-2 overall.
- Only twice in the past 55 years has a team won the NBA championship despite finishing worse in scoring and defense than its opponent: The 2010-11 Dallas Mavericks (who knocked off Miami) and the 2021-22 Golden State Warriors (who upended Boston).

NHL
| Result | Rate |
|---|---|
| Better offensive team won | 65.5% |
| Better defensive team won | 58.2% |
- Average offensive ranking of championship winner: 5.5
- Average defensive ranking of championship winner: 5.8
- Average offensive ranking of championship runner-up: 8.3
- Average defensive ranking of championship runner-up: 7.2
Say what you will about the incredible parity in the National Hockey League over the past 15+ years, but the better team still comes out ahead the majority of the time. And as with the NBA, you're more likely to see an offensive juggernaut carry the day.
The gap between the average rankings of Stanley Cup champions and those of the runners-up is striking, particularly on the offensive end. This suggests that, while the NHL might see more "Cinderella" teams reach the final than any of the other four sports, at least in terms of overall offensive production, those teams often come up short in the end.
And while any NHL team can beat another on a given night during the regular season, the Stanley Cup playoffs brings out the best in the top teams. Only one NHL championship series since 1967 has failed to feature a team ranked in the top-five in either goal scoring or goal prevention during the regular season, while 43 of the past 55 Stanley Cup champs have ranked no worse than third in at least one of those categories.
A few additional factoids:
- The 2020-21 Montreal Canadiens are the only team since the expansion to 12 teams to reach the Stanley Cup final despite finishing in the bottom half in both offense and defense.
- The top-ranked offensive team has reached the Stanley Cup final 18 times since 1967, going 11-7 – but only two No. 1s (Pittsburgh, 2017; Tampa Bay, 2020) have prevailed since 1992.
- By comparison, the NHL's best defensive team has also reached the Stanley Cup final 18 times in the past 56 years, but has an incredible 14-4 record.

MLB
| Result | Rate |
|---|---|
| Better offensive team won | 63.0% |
| Better defensive team won | 38.9% |
- Average offensive ranking of championship winner: 7.2
- Average defensive ranking of championship winner: 7.3
- Average offensive ranking of championship runner-up: 8.0
- Average defensive ranking of championship runner-up: 6.2
Huh?
We don't want to suggest that good pitching and defense don't matter, but offense has played a much, much larger role in determining who ultimately takes home the World Series title. Not only has the better offensive team won 63 percent of all MLB championships, the team with the superior regular-season run prevention has prevailed less than 40 percent of the time.
How crazy is the trend? Since 1995, 20 teams that ranked in the top three during the season in runs allowed have reached the World Series – and only six have gone on to win. That includes a four-year stretch from 2017-20 in which four straight top-three defensive teams lost in the championship series (though the No. 3 Tampa Bay Rays lost to the No. 1 Los Angeles Dodgers in the 2020 World Series).
On the flip side, boasting a lineup full of mashers is a sure-fire way to not only participate in a little November baseball, but to win a title in the process. Since 2013, 11 of the 22 World Series participants have ranked in the top five in runs scored during the season, while 10 of the past 11 champions finished no lower than eighth offensively.
A few extra trends:
- The league's No. 1 run-scoring team has reached the World Series 15 times since 1969, winning 11 of those appearances.
- On the flip side, the top run-prevention unit has reached the MLB championship series 14 times over that span, going 7-7 overall.
- No team in the past 55 years has reached the World Series while ranking in the bottom half offensively and defensively; the 2023 Arizona Diamondbacks came closest in recent history, ranked 14th in run scoring and 20th in run prevention.


