NHL EDGE Data Analysis: How Far Did Your Favorite Team Skate Last Season?


You don't need to bury yourself in NHL advanced stats to have an appreciation for the skill and speed of today's game – but folks, it sure is fun.
I spent some time in the NHL EDGE Puck and Player Tracking Data library, which monitors statistics like skating speed, skating distance, shot speed, and shot and save location for every player in the league. And I came away with some truly amazing facts mined from last year's results – made even more fun with the magic of context.
Here's a look at the highlights:
The Stanley Cup champions skated from Alaska to Florida
It might not occur to the casual fan, but professional hockey players do a lot of skating.
Up until recently, we didn't really know just how much ground these guys covered – but now that every player shift is tracked with irrefutable accuracy, we can tell you that teams that go deep in the Stanley Cup playoffs rack up enough on-ice miles to compare favorably to a very uncomfortable family trip.
Here's a look at last season's skating mileage leaders, compared against a drive from Anchorage, Alaska to the home of the defending champs:
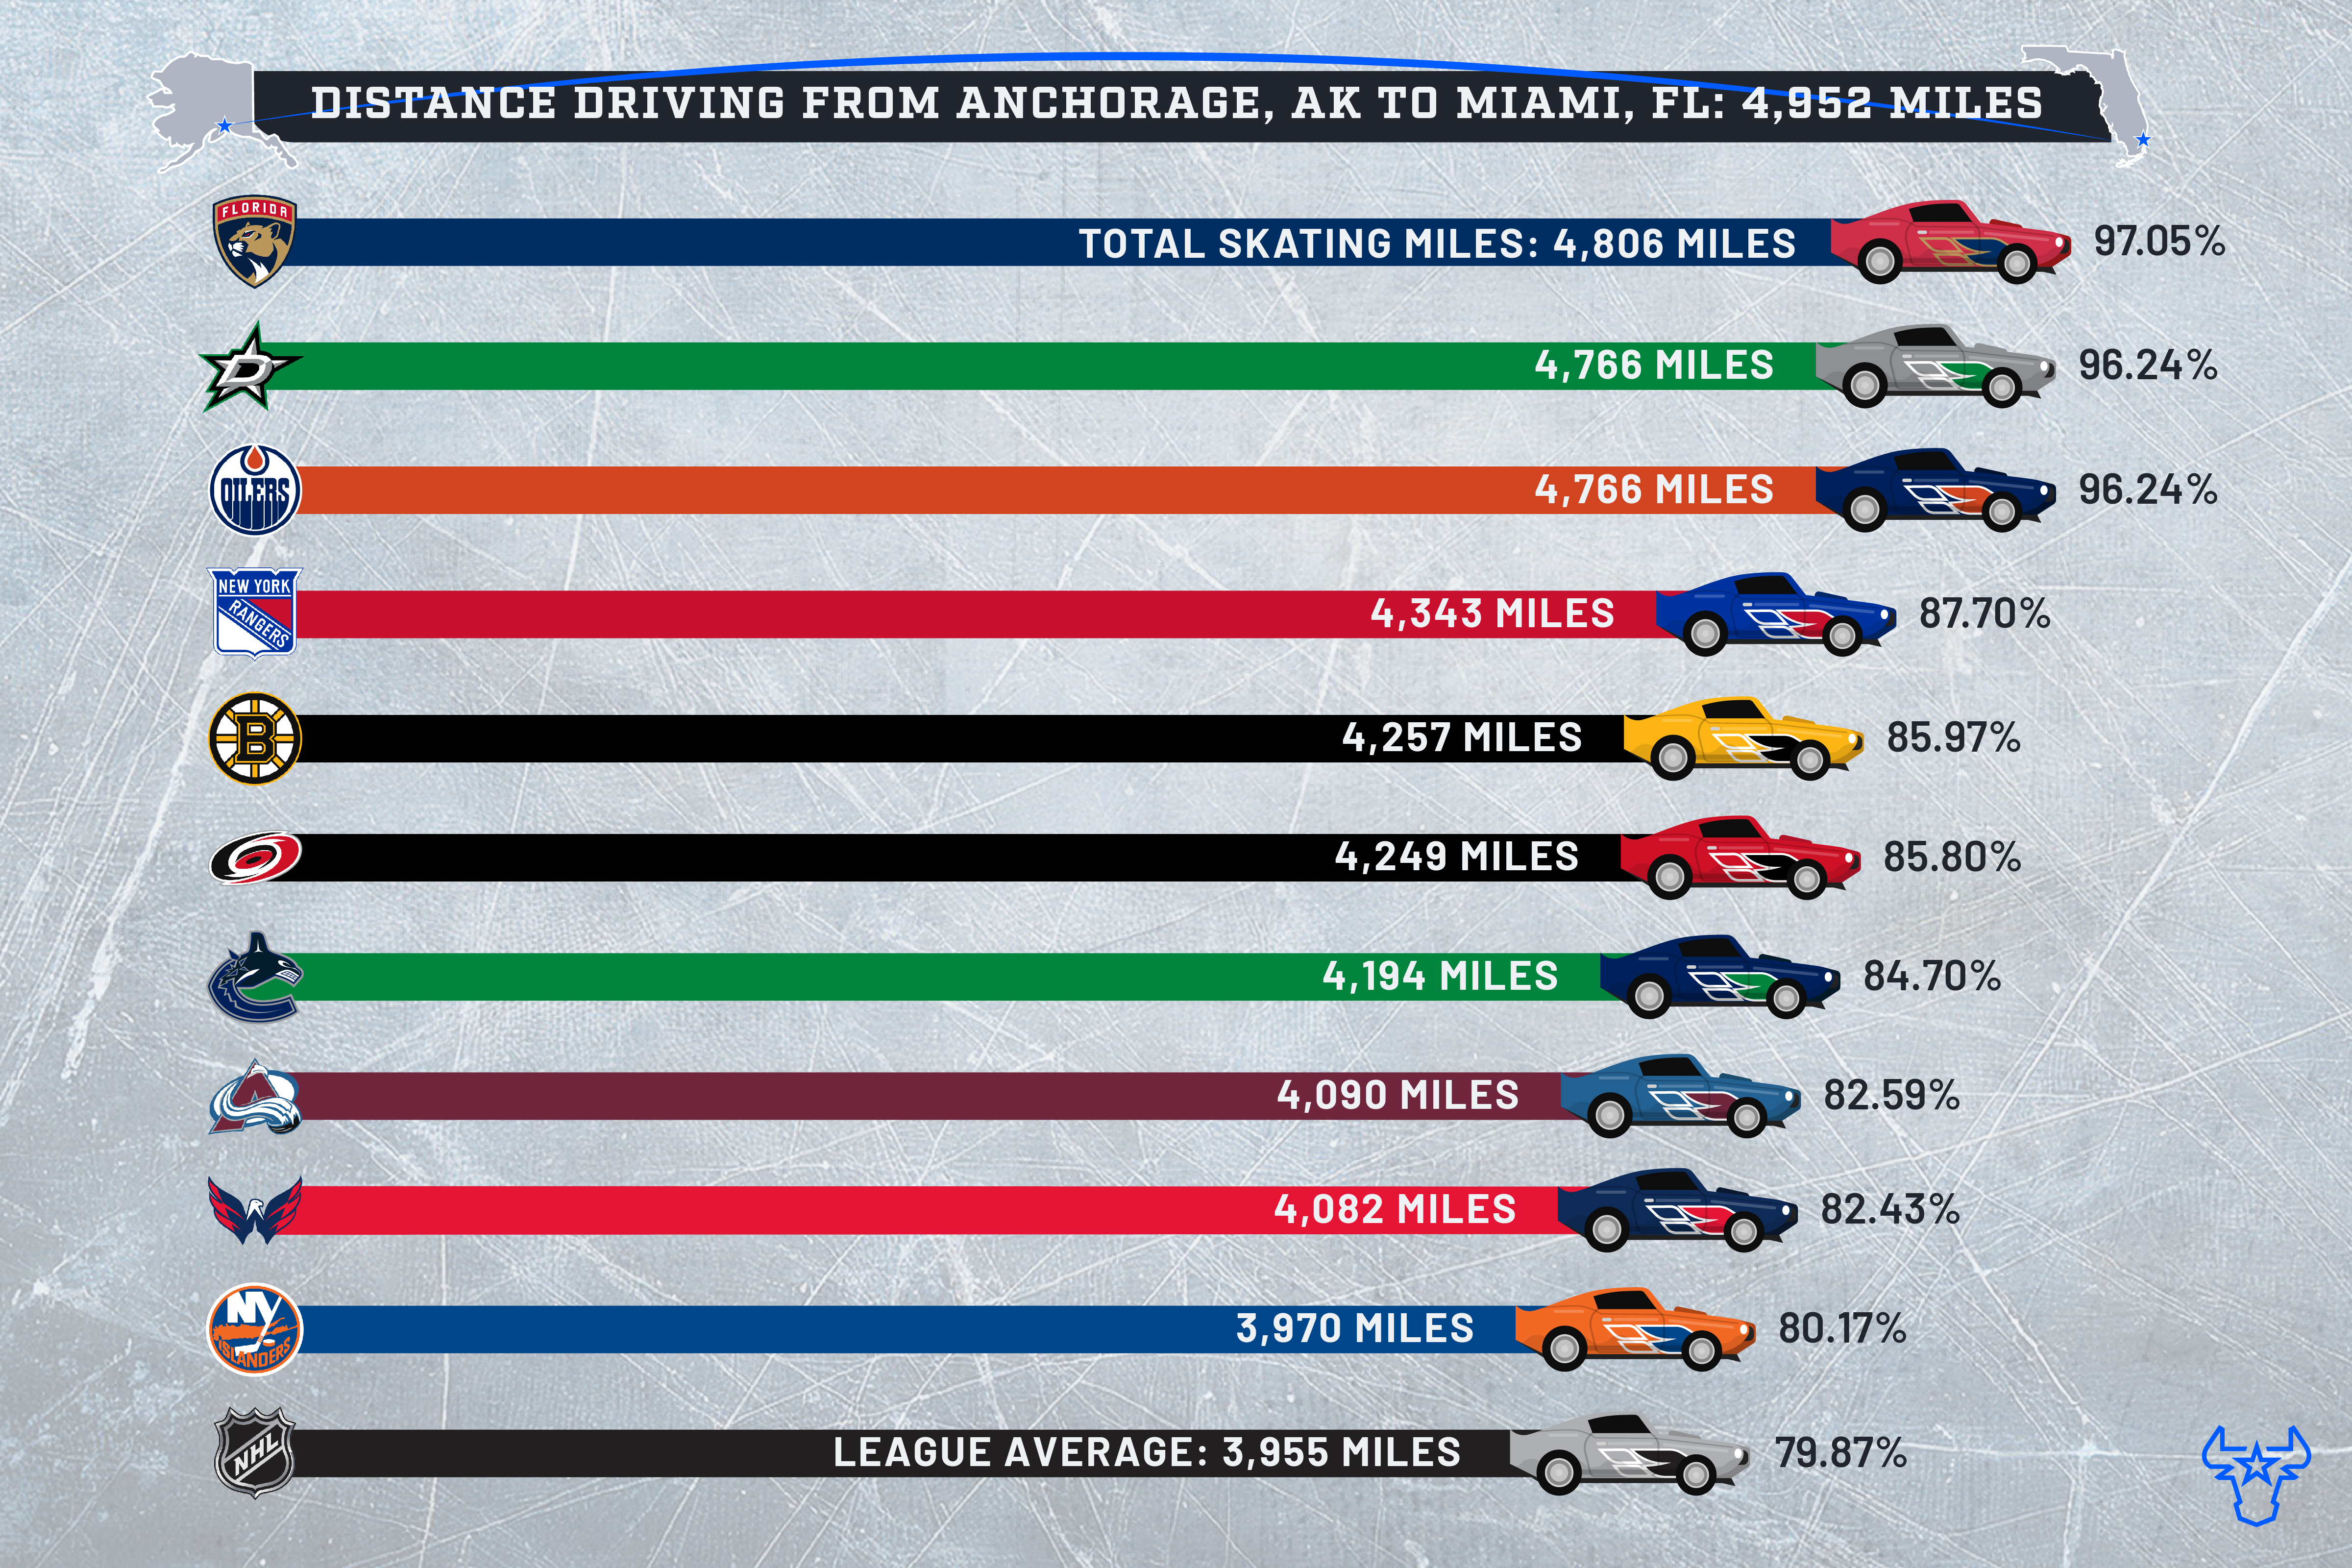
You can be sure that those Panthers players were running purely on adrenaline as they put in their final miles of the season while hoisting a 35-pound trophy above their heads.
The runner-up Edmonton Oilers earned the distinction (along with the Dallas Stars, whom they eliminated in the Western Conference final) of skating the farthest without winning a blasted thing. Interestingly, the other conference finalist, the New York Rangers, finished a whopping 433 miles behind the Stars and Oilers in fourth place.
The Boston Bruins round out the top five at 4,257 miles, roughly equal to a return drive from Chicago to San Francisco (and back). That might not be on the same level as the top three teams, but it's still a lot of ground to cover on skates.
Total team skating distance
| Rank | Team | Skating Distance (miles) |
|---|---|---|
| 1 | Florida Panthers | 4,806 |
| T2 | Dallas Stars | 4,766 |
| T2 | Edmonton Oilers | 4,766 |
| 4 | New York Rangers | 4,343 |
| 5 | Boston Bruins | 4,257 |
| 6 | Carolina Hurricanes | 4,249 |
| 7 | Vancouver Canucks | 4,194 |
| 8 | Colorado Avalanche | 4,090 |
| 9 | Washington Capitals | 4,082 |
| 10 | New York Islanders | 3,970 |
| 11 | Nashville Predators | 3,967 |
| 12 | Los Angeles Kings | 3,924 |
| 13 | Toronto Maple Leafs | 3,882 |
| 14 | Vegas Golden Knights | 3,879 |
| 15 | Calgary Flames | 3,876 |
| 16 | Seattle Kraken | 3,852 |
| 17 | Columbus Blue Jackets | 3,824 |
| 18 | Winnipeg Jets | 3,805 |
| 19 | Chicago Blackhawks | 3,803 |
| 20 | Philadelphia Flyers | 3,796 |
| 21 | Montreal Canadiens | 3,795 |
| T22 | Arizona Coyotes | 3,776 |
| T22 | Tampa Bay Lightning | 3,776 |
| 24 | New Jersey Devils | 3,775 |
| 25 | Buffalo Sabres | 3,747 |
| 26 | Pittsburgh Penguins | 3,712 |
| 27 | Detroit Red Wings | 3,689 |
| 28 | St. Louis Blues | 3,685 |
| 29 | San Jose Sharks | 3,668 |
| 30 | Ottawa Senators | 3,640 |
| 31 | Minnesota Wild | 3,599 |
| 32 | Anaheim Ducks | 3,577 |
And if you're the kind of reader who prefers a visual representation of just how far that is, here's a look at the full driving route (complete with major construction snags!)

And one final icing (get it? Ice!) on the cake, all 32 teams combined to cover 126,569.7 miles – equivalent to a whopping 5.3 trips around the world!
Oilers star Connor McDavid left the Hubble Telescope in his (ice) dust
We don't stick to sports at Sportsbook Review.
One day you might find yourself immersed in our Westminster Dog Show odds; the next, you're looking up our 2025 Oscars odds for movies like Dune: Part Two or Ghostbusters.
We aim to educate. And our latest "Did You Know": the NHL's mileage Ironman from last season skated 18% farther than the distance from Earth to the Hubble Telescope:
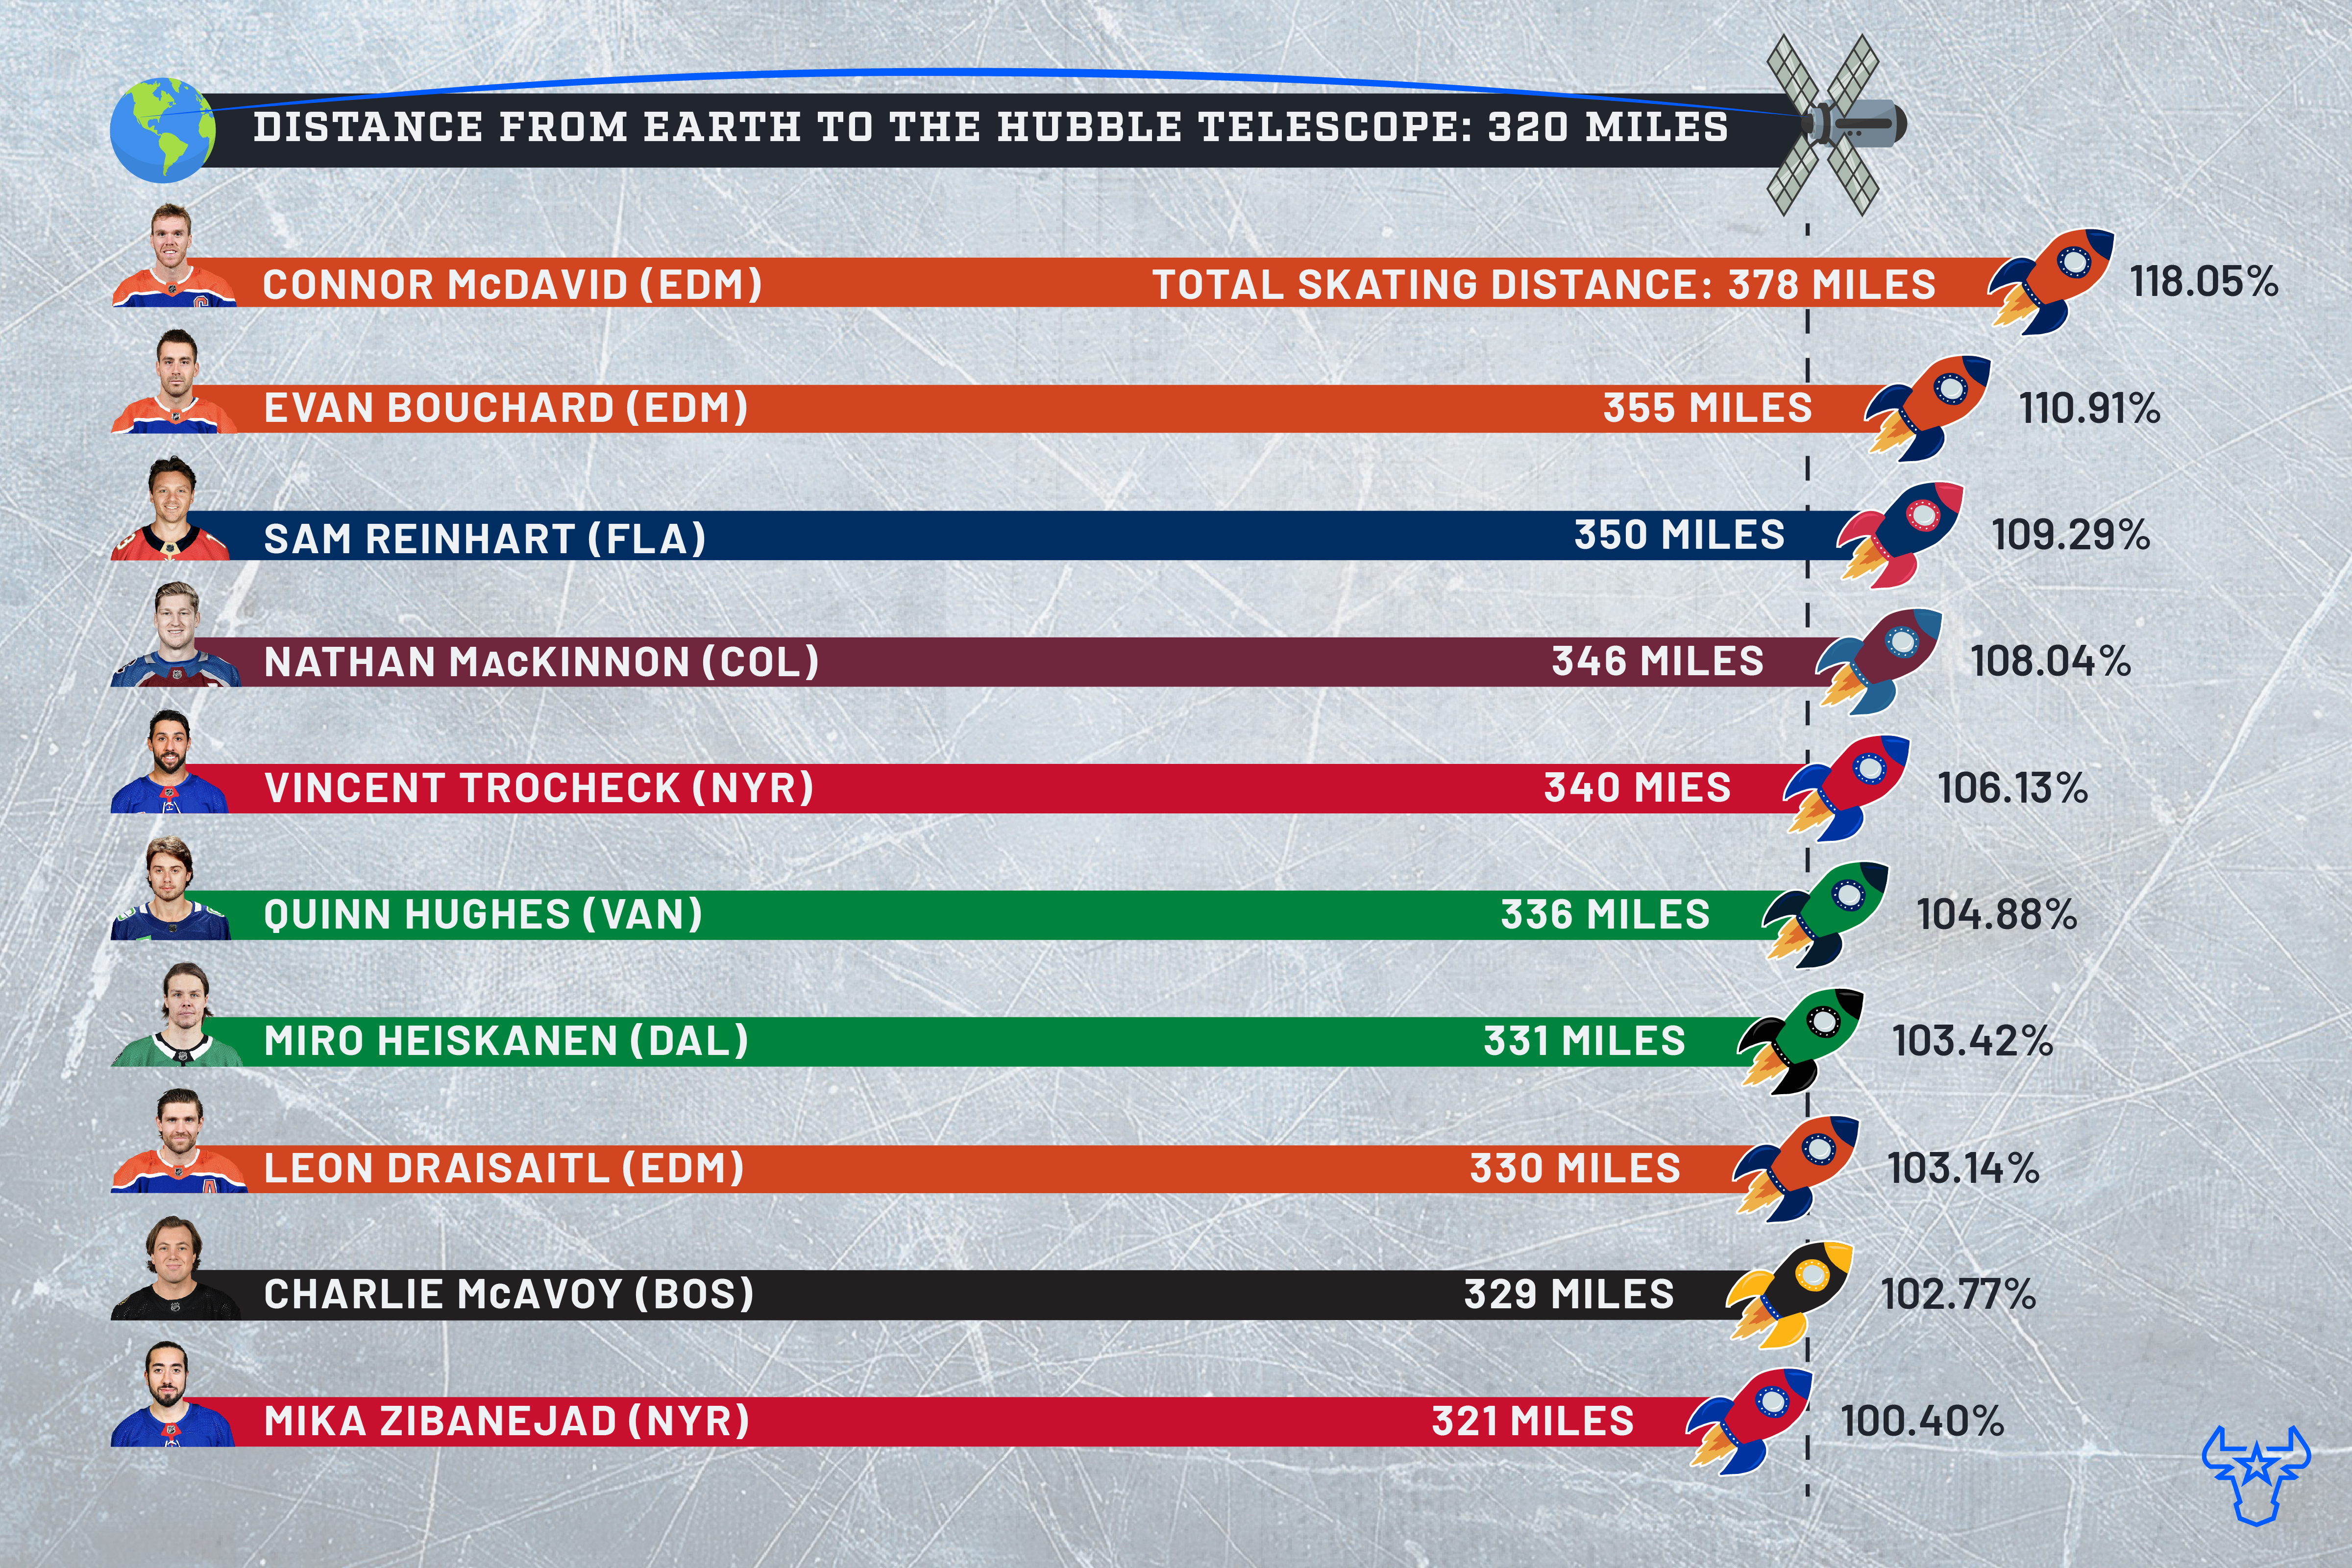
McDavid wasn't alone in achieving this feat: 10 players put in more than 320 miles on NHL ice sheets last season, including two of his teammates. But you have to hand it to the three-time NHL Most Valuable Player for winning the endurance title by nearly a marathon's worth of skating miles (with over 100 of them coming in the playoffs).
Beyond McDavid and Evan Bouchard, it's no surprise to see a Panthers forward hold down the No. 3 spot. League scoring champion and Hart Trophy winner Nathan MacKinnon finished fourth last season, thanks to leading all skaters with 300 regular-season miles.
Vincent Trocheck of the New York Rangers wound up fifth, followed by a pair of talented defensemen in Quinn Hughes of the Vancouver Canucks and Miro Heiskanen of the Stars.
| Rank | Player | Team | Skating Distance (miles) |
|---|---|---|---|
| 1 | Connor McDavid | Edmonton Oilers | 378 |
| 2 | Evan Bouchard | Edmonton Oilers | 355 |
| 3 | Sam Reinhart | Florida Panthers | 350 |
| 4 | Nathan MacKinnon | Colorado Avalanche | 346 |
| 5 | Vincent Trocheck | New York Rangers | 340 |
| 6 | Quinn Hughes | Vancouver Canucks | 336 |
| 7 | Miro Heiskanen | Dallas Stars | 331 |
| 8 | Leon Draisaitl | Edmonton Oilers | 330 |
| 9 | Charlie McAvoy | Boston Bruins | 329 |
| 10 | Mika Zibanejad | New York Rangers | 321 |
| T11 | Thomas Harley | Dallas Stars | 320 |
| T11 | Ryan Nugent-Hopkins | Edmonton Oilers | 320 |
| 13 | Cale Makar | Colorado Avalanche | 317 |
| T14 | Roman Josi | Nashville Predators | 316 |
| T14 | Gustav Forsling | Florida Panthers | 316 |
| 16 | Niko Mikkola | Florida Panthers | 315 |
| 17 | Drew Doughty | Los Angeles Kings | 313 |
| T18 | Aleksander Barkov | Florida Panthers | 312 |
| T18 | Artemi Panarin | New York Rangers | 312 |
| T18 | Josh Morrissey | Winnipeg Jets | 312 |
| T18 | Mattias Ekholm | Edmonton Oilers | 312 |
Owen Tippett flashed elite polar bear evasion speed
It has been a terrific 2024 for Owen Tippett by just about any measure.
The 25-year-old is coming off a second straight solid season in which he recorded career bests in goals (28) and points (53) for a Philadelphia Flyers team that exceeded most people's expectations. And he was rewarded for that showing, signing an eight-year extension worth nearly $50 million (US).
What makes Tippett so dangerous? Well, this, for starters:
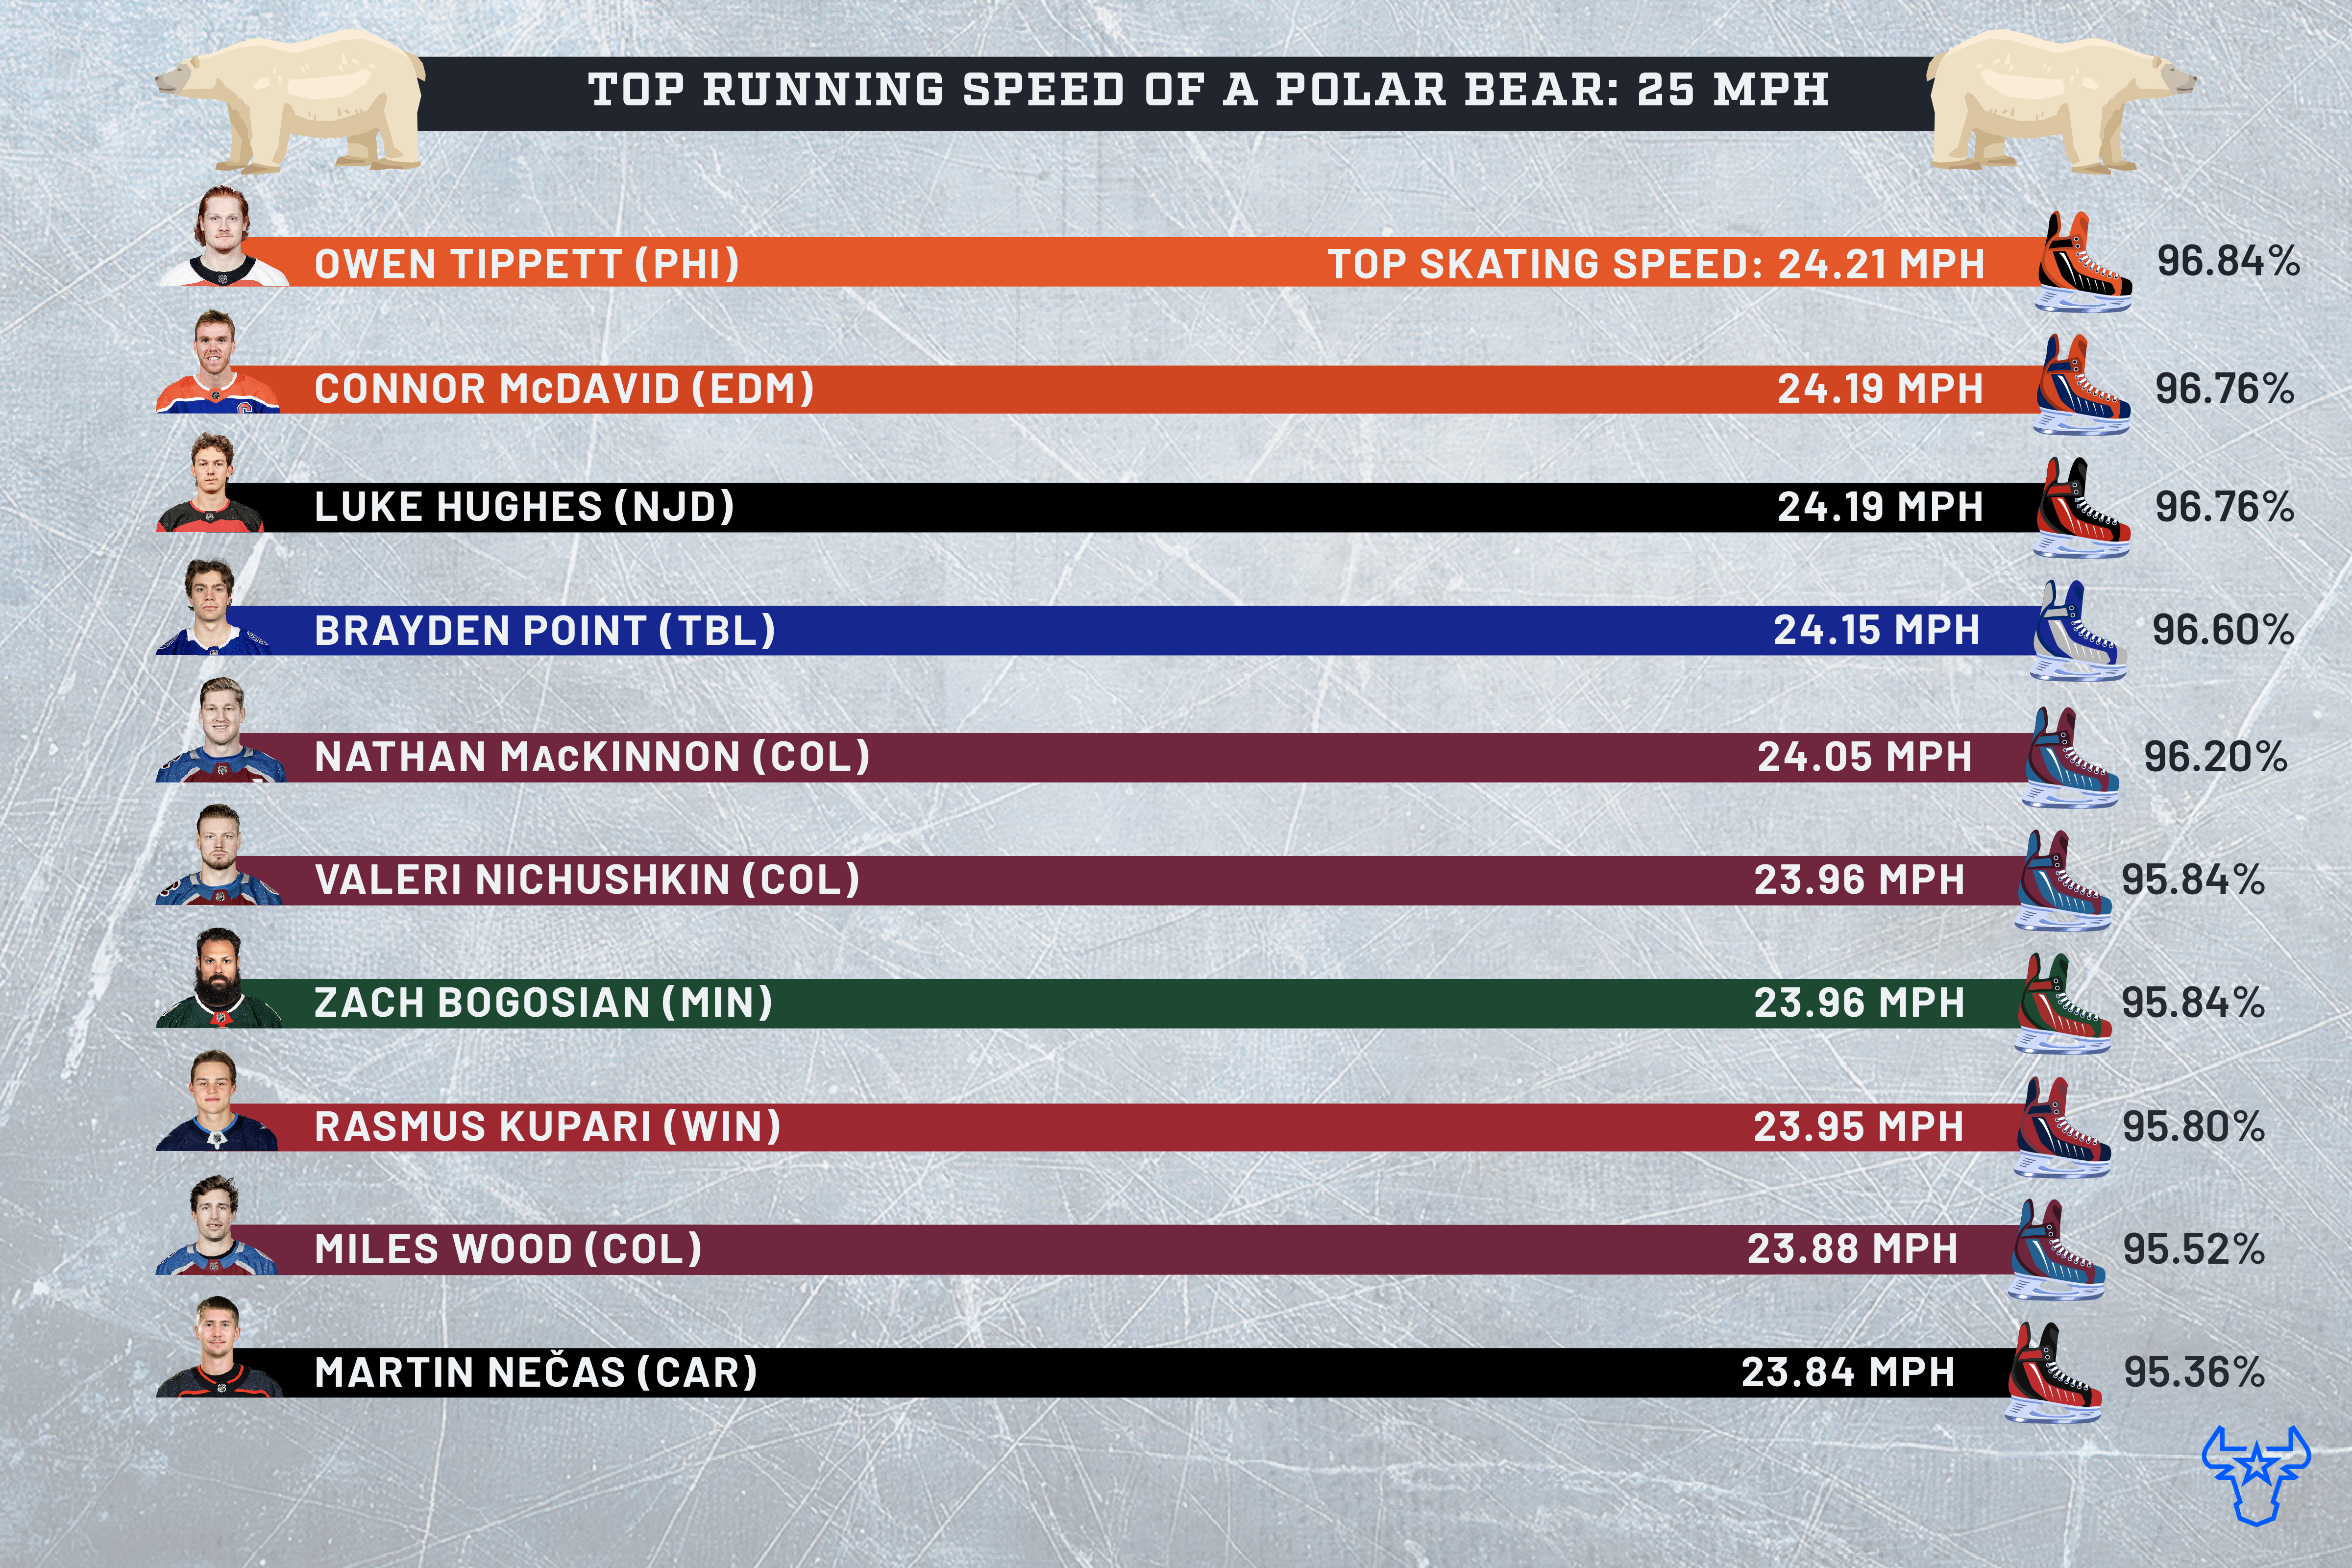
Tippett earned the crown as the NHL's fastest man, narrowly edging out McDavid and rookie New Jersey Devils defenseman Luke Hughes. (I hope McDavid, who was married over the summer, found some time to just lay in bed and eat Oreos. He worked hard last season.)
All three fared impressively well when comparing their top speeds to that of a polar bear (and I'm willing to bet they would all find an extra gear if they were actually being chased by one.)
Another repeat name makes an appearance on this list, with MacKinnon wrapping up the top five just a tenth of a mile-per-hour behind Brayden Point of the Tampa Bay Lightning.
| Rank | Player | Team | Top Skating Speed (mph) |
|---|---|---|---|
| 1 | Owen Tippett | Philadelphia Flyers | 24.21 |
| T2 | Connor McDavid | Edmonton Oilers | 24.19 |
| T2 | Luke Hughes | New Jersey Devils | 24.19 |
| 4 | Brayden Point | Tampa Bay Lightning | 24.15 |
| 5 | Nathan MacKinnon | Colorado Avalanche | 24.05 |
| T6 | Valeri Nichushkin | Colorado Avalanche | 23.96 |
| T6 | Zach Bogosian | Minnesota Wild | 23.96 |
| 8 | Rasmus Kupari | Winnipeg Jets | 23.95 |
| 9 | Miles Wood | Colorado Avalanche | 23.88 |
| 10 | Martin Necas | Carolina Hurricanes | 23.84 |
Josh Manson's hardest shot was a real screamer
We might never see an NHL player record a shot speed equal to the fastest roller-coaster in North America – but it's still fun to compare them.
Let's start with the coaster in question: The bladder-humbling Kingda Ka, located at Six Flags Great Adventure in Jackson, NJ. It reaches top speeds of 120 mph, and it's also the tallest roller coaster in the world, in case you needed another reason to either plan an immediate trip to Jackson or never, ever visit there.
Here's how last year's top slap shot artists fared against the speed of Kingda Ka:
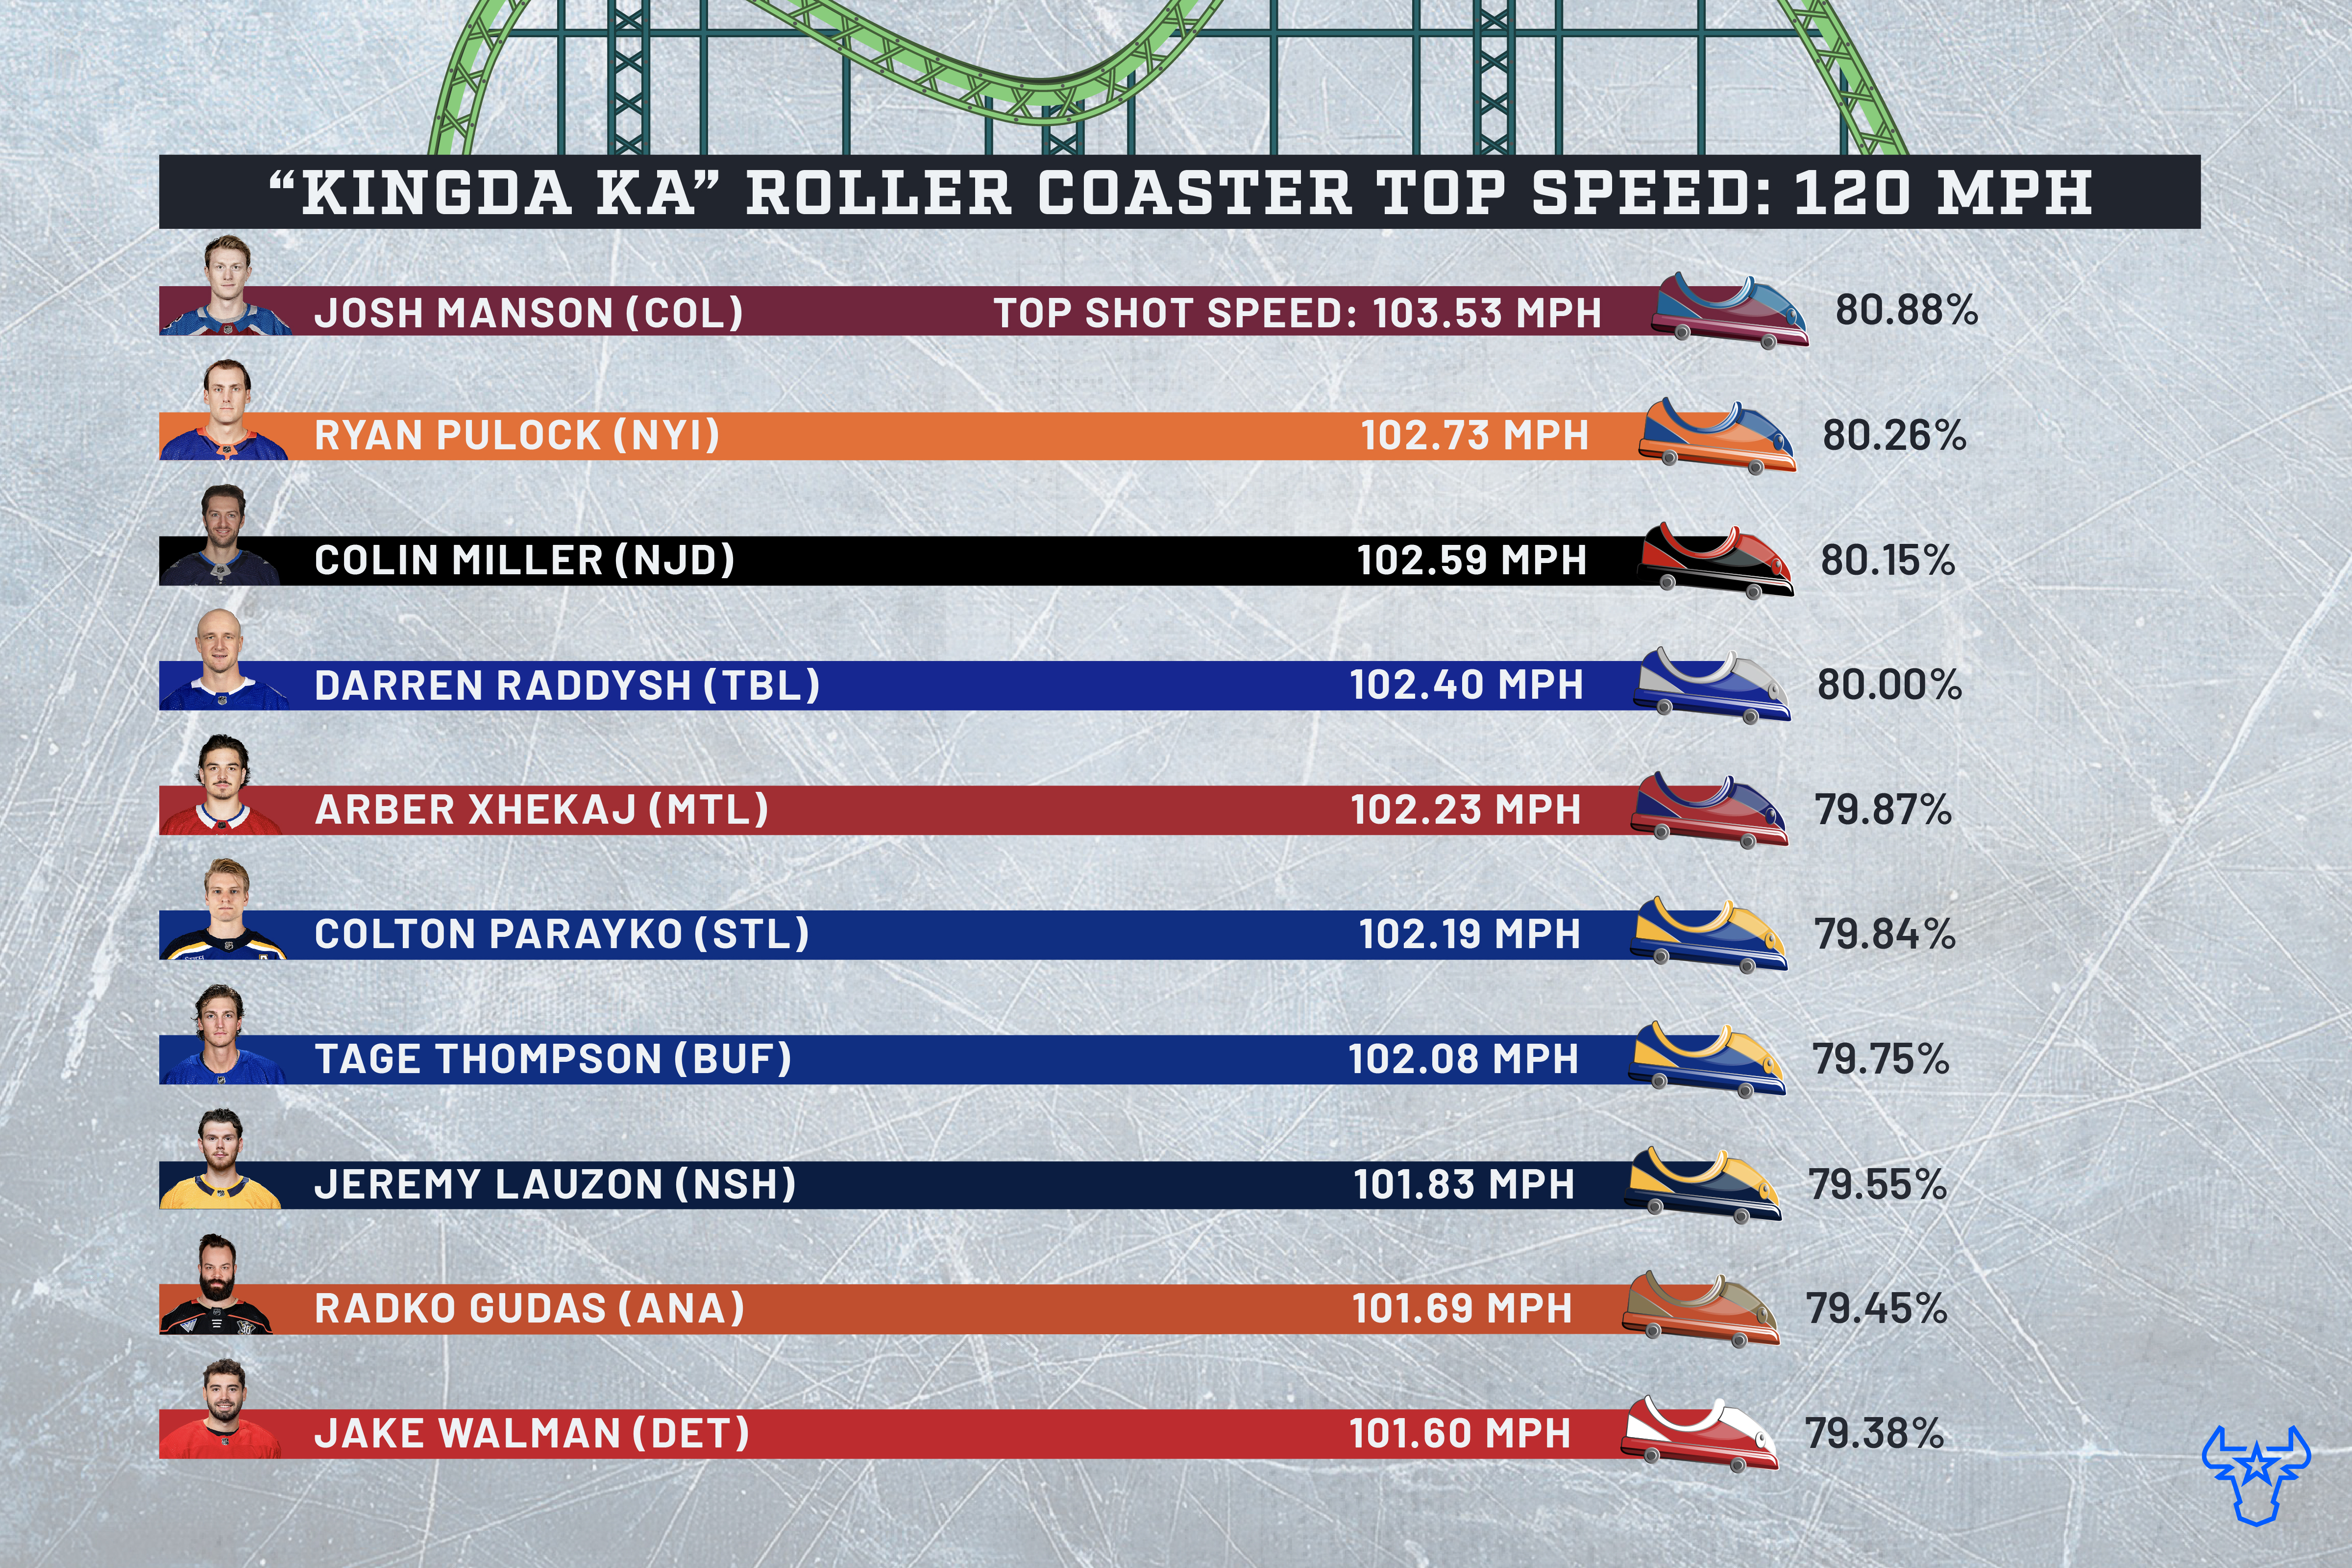
The reigning King of Clappers, Josh Manson of the Colorado Avalanche, reached a top shot speed of 103.53 mph, making him the only player last season to exceed the 103 mph threshold. That's faster than all but five roller coasters on the planet. Not bad!
Ryan Pulock of the New York Islanders (102.73 mph), Colin Miller of the Devils (102.59) and Darren Raddysh of the Tampa Bay Lightning (102.40) all managed slap shots that travelled 80% of Kingda Ka's top speed. I don't know if any poor soul happened to get hit by any of these whistlers, but let's all hope not.
Arber Xhekaj of the Montreal Canadiens (102.23) placed fifth despite appearing in just 44 games with the big club. But he has had a shot reach a speed of 107.2 mph earlier in his career – and that, my friends, is fast enough to equal one scary roller coaster ride.
| Rank | Name | Team | Top Shot Speed (mph) |
|---|---|---|---|
| 1 | Josh Manson | Colorado Avalanche | 103.53 |
| 2 | Ryan Pulock | New York Islanders | 102.73 |
| 3 | Colin Miller | New Jersey Devils | 102.59 |
| 4 | Darren Raddysh | Tampa Bay Lightning | 102.4 |
| 5 | Arber Xhekaj | Montreal Canadiens | 102.23 |
| 6 | Colton Parayko | St. Louis Blues | 102.19 |
| 7 | Tage Thompson | Buffalo Sabres | 102.08 |
| 8 | Jeremy Lauzon | Nashville Predators | 101.83 |
| 9 | Radko Gudas | Anaheim Ducks | 101.69 |
| 10 | Jake Walman | Detroit Red Wings | 101.6 |

Related Articles


